# Visual Studio Code
> How to develop Flutter apps in Visual Studio Code.
## Installation and setup {: #setup}
[VS Code][] is a code editor to build and debug apps.
With the Flutter extension installed, you can compile, deploy, and debug
Flutter apps.
To install the latest version of VS Code,
follow Microsoft's instructions for the relevant platform:
- [Install on macOS][]
- [Install on Windows][]
- [Install on Linux][]
[VS Code]: https://code.visualstudio.com/
[Install on macOS]: https://code.visualstudio.com/docs/setup/mac
[Install on Windows]: https://code.visualstudio.com/docs/setup/windows
[Install on Linux]: https://code.visualstudio.com/docs/setup/linux
### Install the Flutter extension {: #install-extension}
1. Start **VS Code**.
1. Open a browser and go to the [Flutter extension][] page
on the Visual Studio Marketplace.
1. Click **Install**.
Installing the Flutter extension also installs the Dart extension.
[Flutter extension]: https://marketplace.visualstudio.com/items?itemName=Dart-Code.flutter
### Validate your VS Code setup {: #validate-setup}
1. Go to **View** >
**Command Palette...**.
You can also press Ctrl / Cmd +
Shift + P.
1. Type `doctor`.
1. Select **Flutter: Run Flutter Doctor**.
Once you select this command, VS Code does the following:
- Opens the **Output** panel.
- Displays **flutter (flutter)** in the dropdown on the upper right
of this panel.
- Displays the output of `flutter doctor` command.
### Updating the extension {:#updating}
Updates to the extensions are shipped on a regular basis.
By default, VS Code automatically updates extensions when
updates are available.
To install updates yourself:
1. Click **Extensions** in the Side Bar.
1. If the Flutter extension has an available update,
click **Update** and then **Reload**.
1. Restart VS Code.
## Creating projects
There are a couple ways to create a new project.
### Creating a new project
To create a new Flutter project from the Flutter
starter app template:
1. Go to **View** >
**Command Palette...**.
You can also press Ctrl / Cmd +
Shift + P.
1. Type `flutter`.
1. Select the **Flutter: New Project**.
1. Press Enter.
1. Select **Application**.
1. Press Enter.
1. Select a **Project location**.
1. Enter your desired **Project name**.
### Opening a project from existing source code
To open an existing Flutter project:
1. Go to **File** > **Open**.
You can also press Ctrl / Cmd + O
1. Browse to the directory holding your existing
Flutter source code files.
1. Click **Open**.
## Editing code and viewing issues
The Flutter extension performs code analysis.
The code analysis can:
- Highlight language syntax
- Complete code based on rich type analysis
- Navigate to type declarations
- Go to **Go** > **Go to Definition**.
- You can also press F12.
- Find type usages.
- Press Shift + F12.
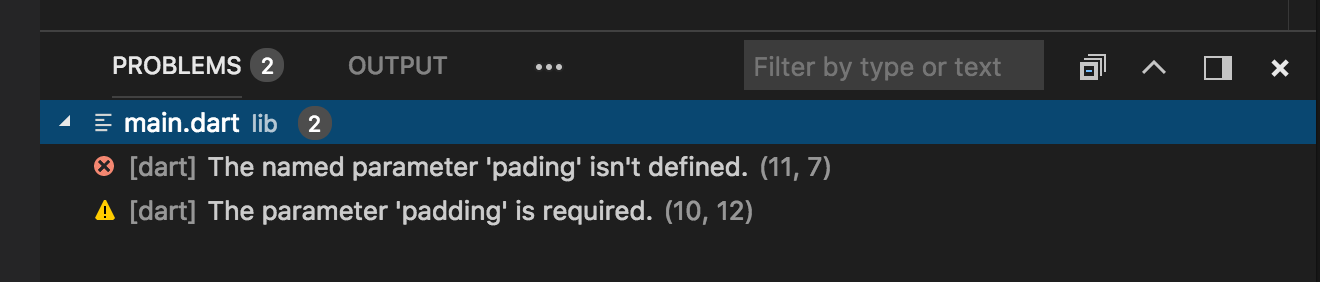
- View all current source code problems.
- Go to **View** > **Problems**.
- You can also press Ctrl / Cmd +
Shift + M.
- The Problems pane displays any analysis issues:
## Running and debugging
:::note
You can debug your app in a couple of ways.
- Using [DevTools][], a suite of debugging and profiling
tools that run in a browser.
- Using VS Code's built-in debugging features,
such as setting breakpoints.
The instructions below describe features available in VS Code.
For information on launching and using DevTools, see
[Running DevTools from VS Code][] in the [DevTools][] docs.
:::
Start debugging by clicking **Run > Start Debugging**
from the main IDE window, or press F5.
### Selecting a target device
When a Flutter project is open in VS Code,
you should see a set of Flutter specific entries in the status bar,
including a Flutter SDK version and a
device name (or the message **No Devices**):
![VS Code status bar][]
:::note
- If you do not see a Flutter version number or device info,
your project might not have been detected as a Flutter project.
Ensure that the folder that contains your `pubspec.yaml` is
inside a VS Code **Workspace Folder**.
- If the status bar reads **No Devices**, Flutter has not been
able to discover any connected iOS or Android devices or simulators.
You need to connect a device, or start a simulator or emulator,
to proceed.
:::
The Flutter extension automatically selects the last device connected.
However, if you have multiple devices/simulators connected, click
**device** in the status bar to see a pick-list
at the top of the screen. Select the device you want to use for
running or debugging.
:::secondary
**Are you developing for macOS or iOS remotely using
Visual Studio Code Remote?** If so, you might need to manually
unlock the keychain. For more information, see this
[question on StackExchange][].
:::
[question on StackExchange]: https://superuser.com/questions/270095/when-i-ssh-into-os-x-i-dont-have-my-keychain-when-i-use-terminal-i-do/363840#363840
### Run app without breakpoints
Go to **Run** > **Start Without Debugging**.
You can also press Ctrl + F5.
### Run app with breakpoints
1. If desired, set breakpoints in your source code.
1. Click **Run** > **Start Debugging**.
You can also press F5.
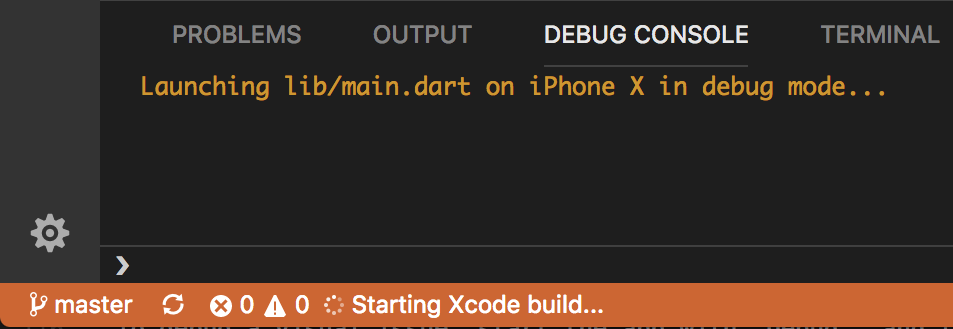
The status bar turns orange to show you are in a debug session.
- The left **Debug Sidebar** shows stack frames and variables.
- The bottom **Debug Console** pane shows detailed logging output.
- Debugging is based on a default launch configuration.
To customize, click the cog at the top of the
**Debug Sidebar** to create a `launch.json` file.
You can then modify the values.
### Run app in debug, profile, or release mode
Flutter offers many different build modes to run your app in.
You can read more about them in [Flutter's build modes][].
1. Open the `launch.json` file in VS Code.
If you don't have a `launch.json` file:
{: type="a"}
1. Go to **View** > **Run**.
You can also press Ctrl / Cmd +
Shift + D
The **Run and Debug** panel displays.
1. Click **create a launch.json file**.
1. In the `configurations` section,
change the `flutterMode` property to
the build mode you want to target.
For example, if you want to run in debug mode,
your `launch.json` might look like this:
```json
"configurations": [
{
"name": "Flutter",
"request": "launch",
"type": "dart",
"flutterMode": "debug"
}
]
```
1. Run the app through the **Run** panel.
## Fast edit and refresh development cycle
Flutter offers a best-in-class developer cycle enabling you
to see the effect of your changes almost instantly with the
_Stateful Hot Reload_ feature.
To learn more, check out [Hot reload][].
## Advanced debugging
You might find the following advanced debugging tips useful:
### Debugging visual layout issues
During a debug session,
several additional debugging commands are added to the
[Command Palette][] and to the [Flutter inspector][].
When space is limited, the icon is used as the visual
version of the label.
**Toggle Baseline Painting** {:.theme-icon width="20px"}
: Causes each RenderBox to paint a line at each of its baselines.
**Toggle Repaint Rainbow** {:.theme-icon width="20px"}
: Shows rotating colors on layers when repainting.
**Toggle Slow Animations** {:.theme-icon width="20px"}
: Slows down animations to enable visual inspection.
**Toggle Debug Mode Banner** {:width="20px"}
: Hides the debug mode banner even when running a debug build.
### Debugging external libraries
By default, debugging an external library is disabled
in the Flutter extension. To enable:
1. Select **Settings > Extensions > Dart Configuration**.
2. Check the `Debug External Libraries` option.
## Editing tips for Flutter code
If you have additional tips we should share, [let us know][]!
### Assists & quick fixes
Assists are code changes related to a certain code identifier.
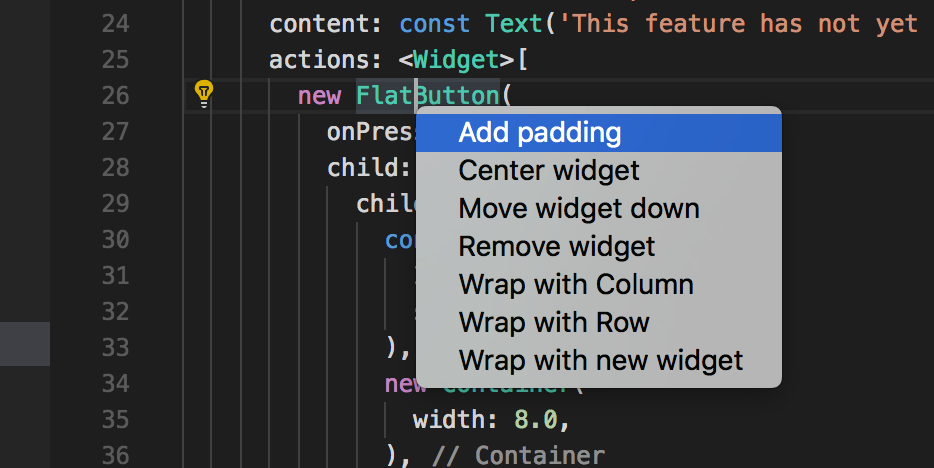
A number of these are available when the cursor is placed on a
Flutter widget identifier, as indicated by the yellow lightbulb icon.
To invoke the assist, click the lightbulb as shown in the following screenshot:
{:width="467px"}
You can also press Ctrl / Cmd + .
Quick fixes are similar,
only they are shown with a piece of code has an error and they
can assist in correcting it.
**Wrap with new widget assist**
: This can be used when you have a widget that you want to wrap
in a surrounding widget, for example if you want to wrap a
widget in a `Row` or `Column`.
**Wrap widget list with new widget assist**
: Similar to the assist above, but for wrapping an existing
list of widgets rather than an individual widget.
**Convert child to children assist**
: Changes a child argument to a children argument,
and wraps the argument value in a list.
**Convert StatelessWidget to StatefulWidget assist**
: Changes the implementation of a `StatelessWidget` to that of
a `StatefulWidget`, by creating the `State` class and moving
the code there.
### Snippets
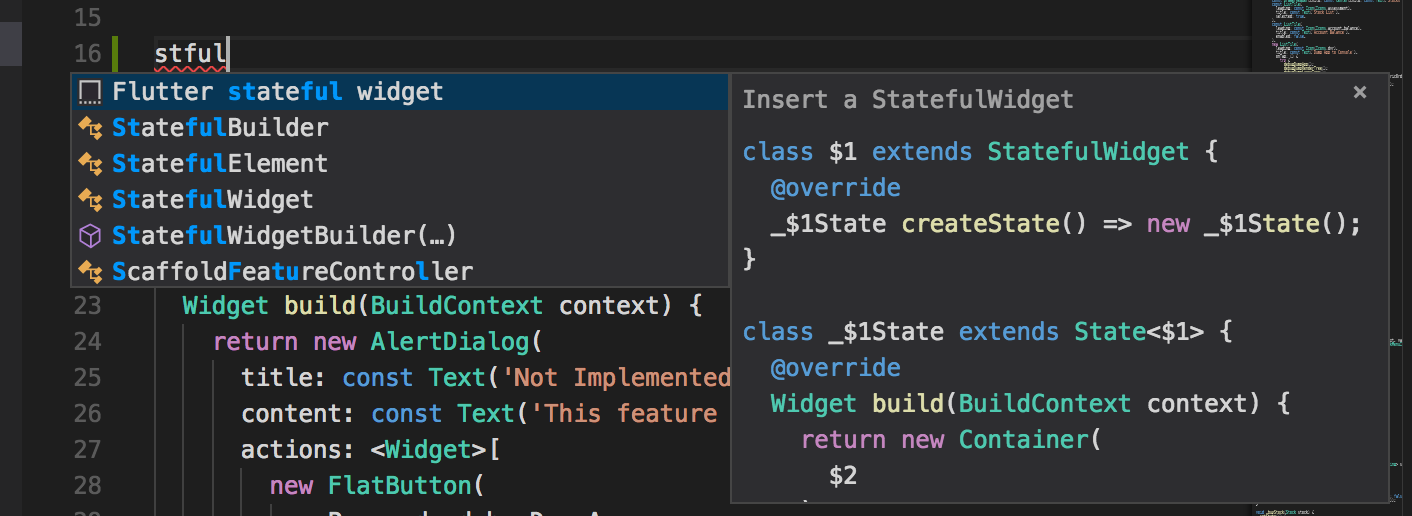
Snippets can be used to speed up entering typical code structures.
They are invoked by typing their prefix,
and then selecting from the code completion window:
{:width="100%"}
The Flutter extension includes the following snippets:
- Prefix `stless`: Create a new subclass of -StatelessWidget`.
- Prefix `stful`: Create a new subclass of `StatefulWidget`
and its associated State subclass.
- Prefix `stanim`: Create a new subclass of `StatefulWidget`,
and its associated State subclass including a field initialized
with an `AnimationController`.
The Dart extension includes the following snippets:
| Prefix | Description | Code Example |
|---|---|---|
| `main` | Insert a main function, used as an entry point. | `void main(List args) { }` |
| `try` | Insert a try/catch block. | `try { } catch (e) { }` |
| `if` | Insert an if statement. | `if (condition) { }` |
| `ife` | Insert an if statement with an else block. | `if (condition) { } else { }` |
| `switch` | Insert a switch statement. | `switch (variable) { case value1: break; case value2: break; default: }` |
| `for` | Insert a for loop. | `for (var i = 0; i < 10; i++) { }` |
| `fori` | Insert a for-in loop. | `for (var item in list) { }` |
| `while` | Insert a while loop. | `while (condition) { }` |
| `do` | Insert a do-while loop. | `do { } while (condition);` |
| `fun` | Insert a function definition. | `void myFunction(String name) { }` |
| `class` | Insert a class definition. | `class MyClass { }` |
| `typedef` | Insert a typedef. | `typedef MyFunction = void Function(String);` |
| `test` | Insert a test block. | `test('My test description', () { });` |
| `group` | Insert a test group block. | `group('My test group', () { });` |
You can also define custom snippets by executing
**Configure User Snippets** from the [Command Palette][].
### Keyboard shortcuts
**Hot reload**
: To perform a hot reload during a debug session,
click **Hot Reload** on the **Debug Toolbar**.
You can also press Ctrl + F5
(Cmd + F5 on macOS).
Keyboard mappings can be changed by executing the
**Open Keyboard Shortcuts** command from the [Command Palette][].
### Hot reload vs. hot restart
Hot reload works by injecting updated source code files into the
running Dart VM (Virtual Machine). This includes not only
adding new classes, but also adding methods and fields to
existing classes, and changing existing functions.
A few types of code changes cannot be hot reloaded though:
- Global variable initializers
- Static field initializers
- The `main()` method of the app
For these changes, restart your app without
ending your debugging session. To perform a hot restart,
run the **Flutter: Hot Restart** command from the [Command Palette][].
You can also press
Ctrl + Shift + F5
or Cmd + Shift + F5 on macOS.
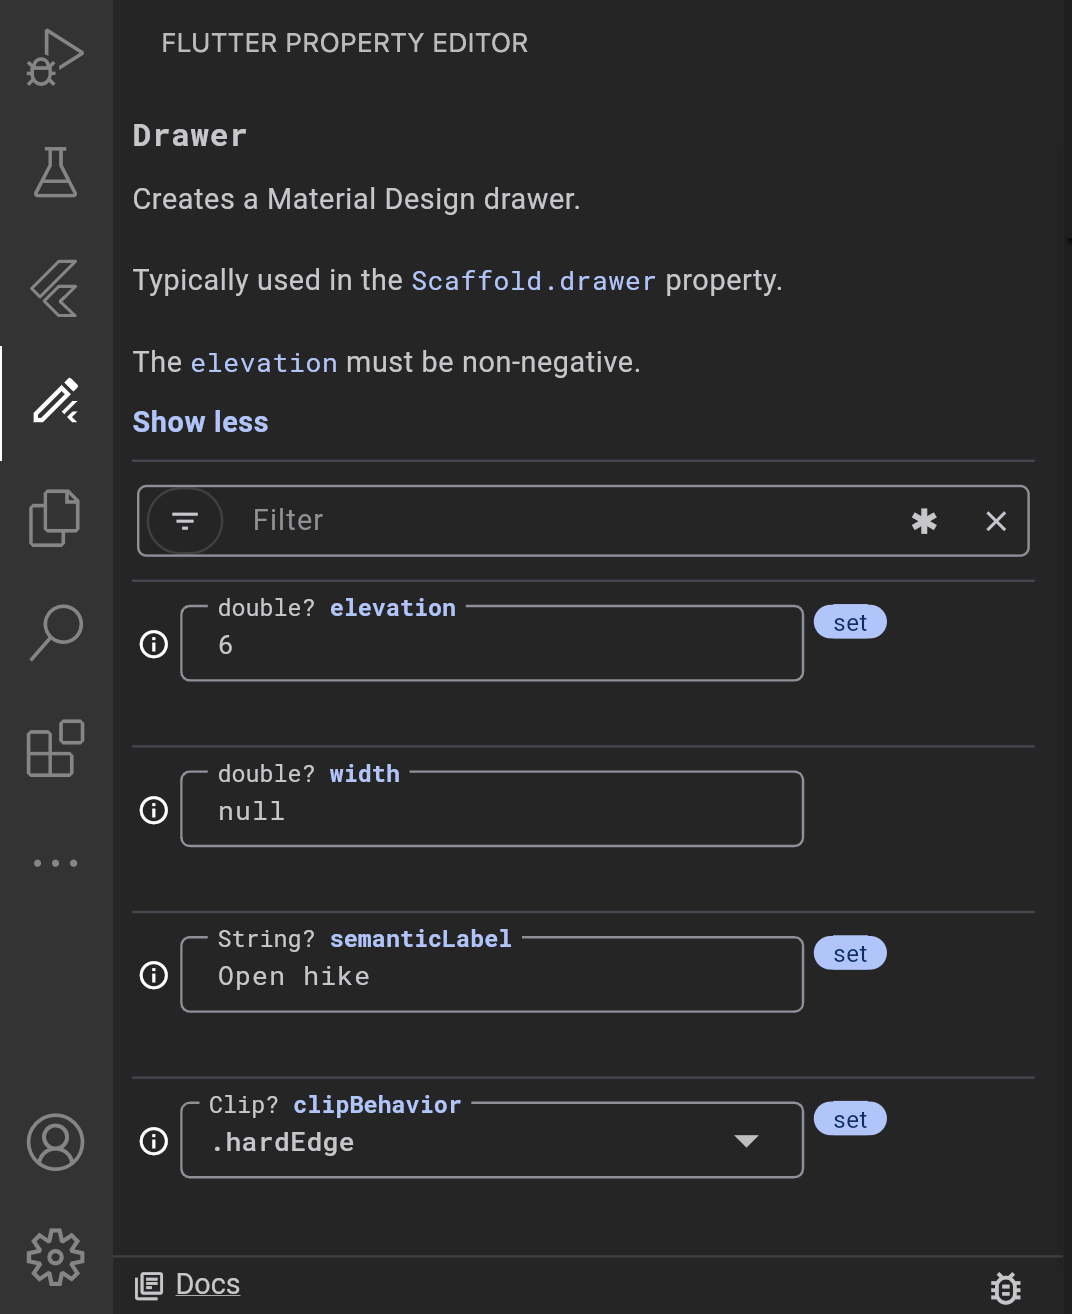
## Flutter Property Editor {: #property-editor}
The Flutter Property Editor is a powerful tool provided by the [Flutter
extension][] that lets you view and modify widget properties directly from its
visual interface.
### How to open the Flutter Property Editor in VS Code
1. Click on the Flutter Property Editor **icon** {:width="20px"} in the VS Code sidebar.
2. The Flutter Property Editor will load in the side panel.
3. Please refer to the Flutter Property Editor [documentation][] for a detailed usage guide.
{:width="600px"}
[Flutter extension]: https://marketplace.visualstudio.com/items?itemName=Dart-Code.flutter
[documentation]: /tools/property-editor
## Troubleshooting
### Known issues and feedback
All known bugs are tracked in the issue tracker:
[Dart and Flutter extensions GitHub issue tracker][issue tracker].
We welcome feedback,
both on bugs/issues and feature requests.
Prior to filing new issues:
- Do a quick search in the issue trackers to see if the
issue is already tracked.
- Make sure you are [up to date](#updating) with the most recent
version of the plugin.
When filing new issues, include [flutter doctor][] output.
[Command Palette]: https://code.visualstudio.com/docs/getstarted/userinterface#_command-palette
[DevTools]: /tools/devtools
[flutter doctor]: /resources/bug-reports/#provide-some-flutter-diagnostics
[Flutter inspector]: /tools/devtools/inspector
[Flutter's build modes]: /testing/build-modes
[Hot reload]: /tools/hot-reload
[let us know]: https://github.com/flutter/website/issues/new
[issue tracker]: https://github.com/Dart-Code/Dart-Code/issues
[Running DevTools from VS Code]: /tools/devtools/vscode
[VS Code status bar]: /assets/images/docs/tools/vs-code/device_status_bar.png