# Use the debugger
> How to use DevTools' source-level debugger.
:::note
DevTools hides the Debugger tab if the app was launched
from VS Code because VS Code has a built-in debugger.
:::
## Getting started
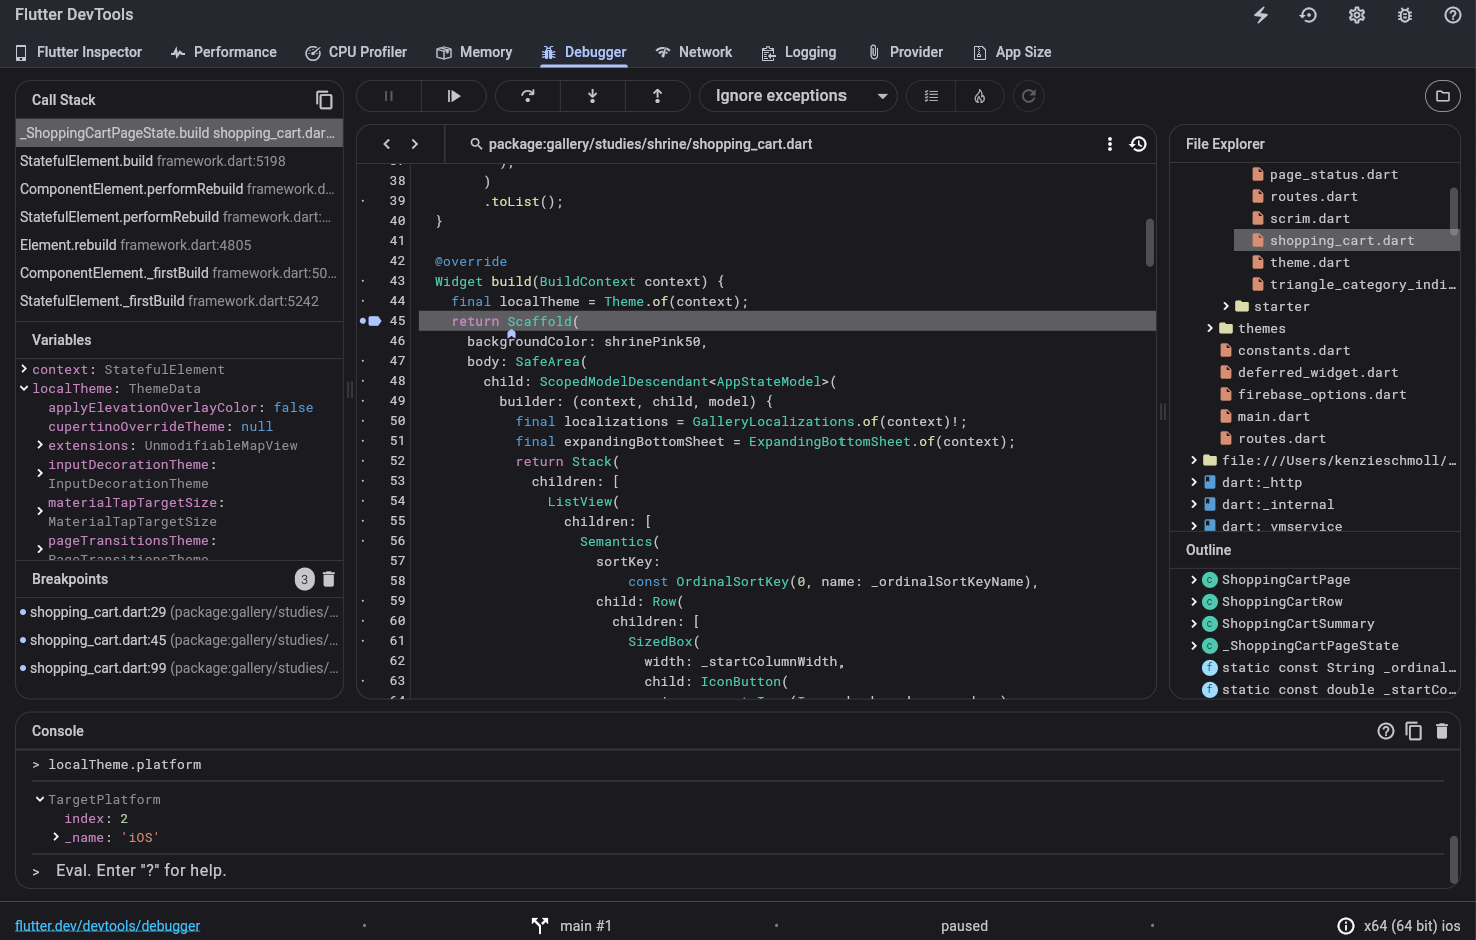
DevTools includes a full source-level debugger,
supporting breakpoints, stepping, and variable inspection.
When you open the debugger tab, you should see the source for the main
entry-point for your app loaded in the debugger.
In order to browse around more of your application sources, click **Libraries**
(top right) or press Ctrl / Cmd + P.
This opens the libraries window and allows you
to search for other source files.
{:width="100%"}
## Setting breakpoints
To set a breakpoint, click the left margin (the line number ruler)
in the source area. Clicking once sets a breakpoint, which should
also show up in the **Breakpoints** area on the left. Clicking
again removes the breakpoint.
## The call stack and variable areas
When your application encounters a breakpoint, it pauses there,
and the DevTools debugger shows the paused execution location
in the source area. In addition, the `Call stack` and `Variables`
areas populate with the current call stack for the paused isolate,
and the local variables for the selected frame. Selecting other
frames in the `Call stack` area changes the contents of the variables.
Within the `Variables` area, you can inspect individual objects by
toggling them open to see their fields. Hovering over an object
in the `Variables` area calls `toString()` for that object and
displays the result.
## Stepping through source code
When paused, the three stepping buttons become active.
* Use **Step in** to step into a method invocation, stopping at
the first executable line in that invoked method.
* Use **Step over** to step over a method invocation;
this steps through source lines in the current method.
* Use **Step out** to step out of the current method,
without stopping at any intermediary lines.
In addition, the **Resume** button continues regular
execution of the application.
## Console output
Console output for the running app (stdout and stderr) is
displayed in the console, below the source code area.
You can also see the output in the [Logging view][].
## Breaking on exceptions
To adjust the stop-on-exceptions behavior, toggle the
**Ignore** dropdown at the top of the debugger view.
Breaking on unhandled excepts only pauses execution if the
breakpoint is considered uncaught by the application code.
Breaking on all exceptions causes the debugger to pause
whether or not the breakpoint was caught by application code.
## Known issues
When performing a hot restart for a Flutter application,
user breakpoints are cleared.
[Logging view]: /tools/devtools/logging
## Other resources
For more information on debugging and profiling, see the
[Debugging][] page.
[Debugging]: /testing/debugging