# Use the CPU profiler view
> Learn how to use the DevTools CPU profiler view.
:::note
The CPU profiler view works with Dart CLI and mobile apps only.
Use Chrome DevTools to [analyze performance][]
of a web app.
:::
The CPU profiler view allows you to record and profile a
session from your Dart or Flutter application.
The profiler can help you solve performance problems
or generally understand your app's CPU activity.
The Dart VM collects CPU samples
(a snapshot of the CPU call stack at a single point in time)
and sends the data to DevTools for visualization.
By aggregating many CPU samples together,
the profiler can help you understand where the CPU
spends most of its time.
:::note
**If you are running a Flutter application,
use a profile build to analyze performance.**
CPU profiles are not indicative of release performance
unless your Flutter application is run in profile mode.
:::
## CPU profiler
Start recording a CPU profile by clicking **Record**.
When you are done recording, click **Stop**. At this point,
CPU profiling data is pulled from the VM and displayed
in the profiler views (Call tree, Bottom up, Method table,
and Flame chart).
To load all available CPU samples without manually
recording and stopping, you can click **Load all CPU samples**,
which pulls all CPU samples that the VM has recorded and
stored in its sample buffer and then
displays those CPU samples in the profiler view.
By default, the VM's sample buffer is used as a ring buffer,
meaning that once it has become full, new samples start
overwriting the oldest ones in the buffer.
To make the VM instead discard all samples collected after
the sample buffer has become full,
pass the `--profile-startup` flag to `dart run` or `flutter run`.
### Bottom up
This table provides a bottom-up representation
of a CPU profile. This means that each top-level method,
or root, in the bottom-up table is actually the
top method in the call stack for one or more CPU samples.
In other words, each top-level method in a bottom-up
table is a leaf node from the top-down table
(the call tree).
In this table, a method can be expanded to show its _callers_.
This view is useful for identifying expensive _methods_
in a CPU profile. When a root node in this table
has a high _self_ time, that means that many CPU samples
in this profile ended with that method on top of the call stack.
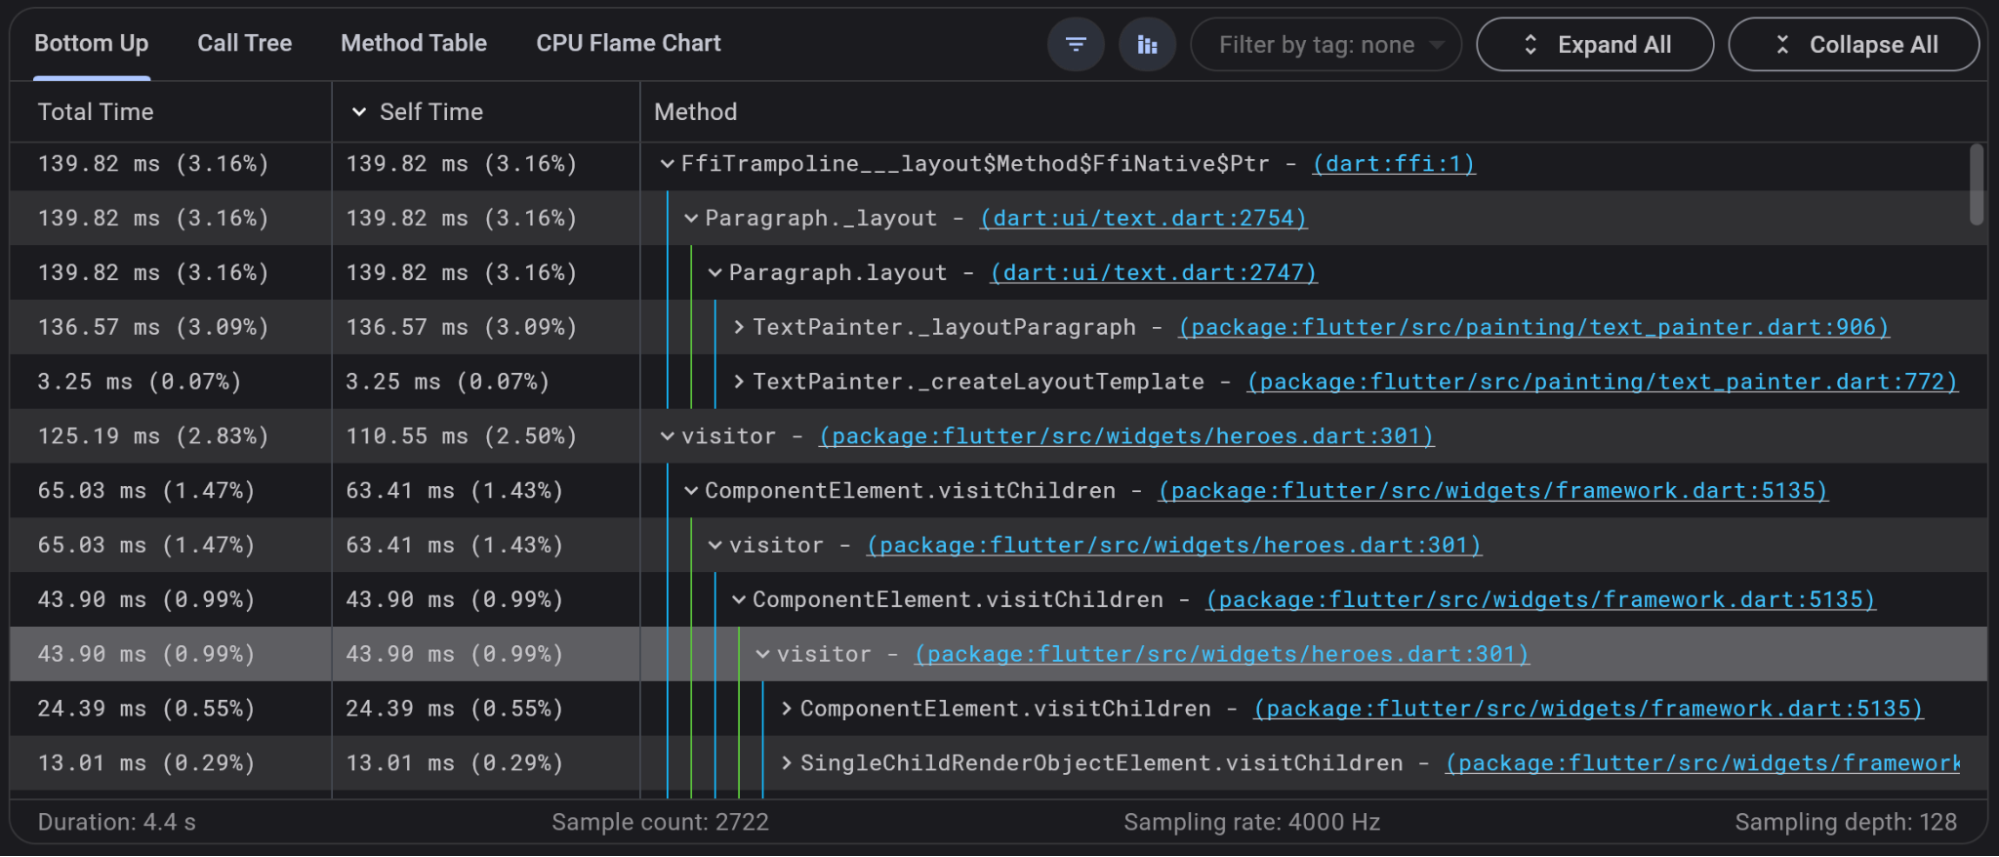
See the [Guidelines](#guidelines) section below to learn how to
enable the blue and green vertical lines seen in this image.
Tooltips can help you understand the values in each column:
**Total time**
: For top-level methods in the bottom-up tree
(stack frames that were at the top of at least one
CPU sample), this is the time the method spent executing
its own code, as well as the code for any methods that
it called.
**Self time**
: For top-level methods in the bottom-up tree
(stack frames that were at the top of at least one CPU
sample), this is the time the method spent executing only
its own code.
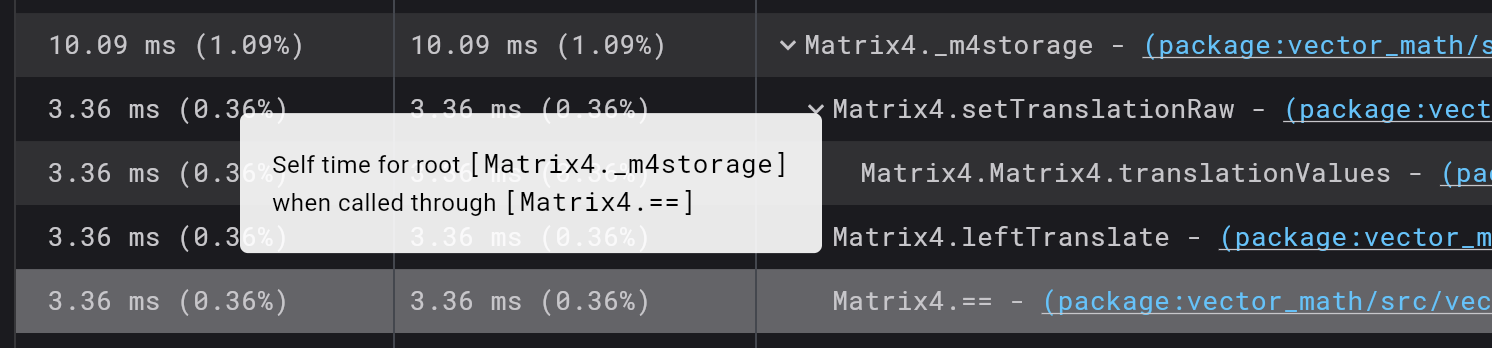
For children methods in the bottom-up tree (the callers),
this is the self time of the top-level method (the callee)
when called through the child method (the caller).
**Table element** (self time)
### Call tree
This table provides a top-down representation of a CPU profile.
This means that each top-level method in the call tree is a root
of one or more CPU samples. In this table,
a method can be expanded to show its _callees_.
This view is useful for identifying expensive _paths_ in a CPU profile.
When a root node in this table has a high _total_ time,
that means that many CPU samples in this profile started
with that method on the bottom of the call stack.
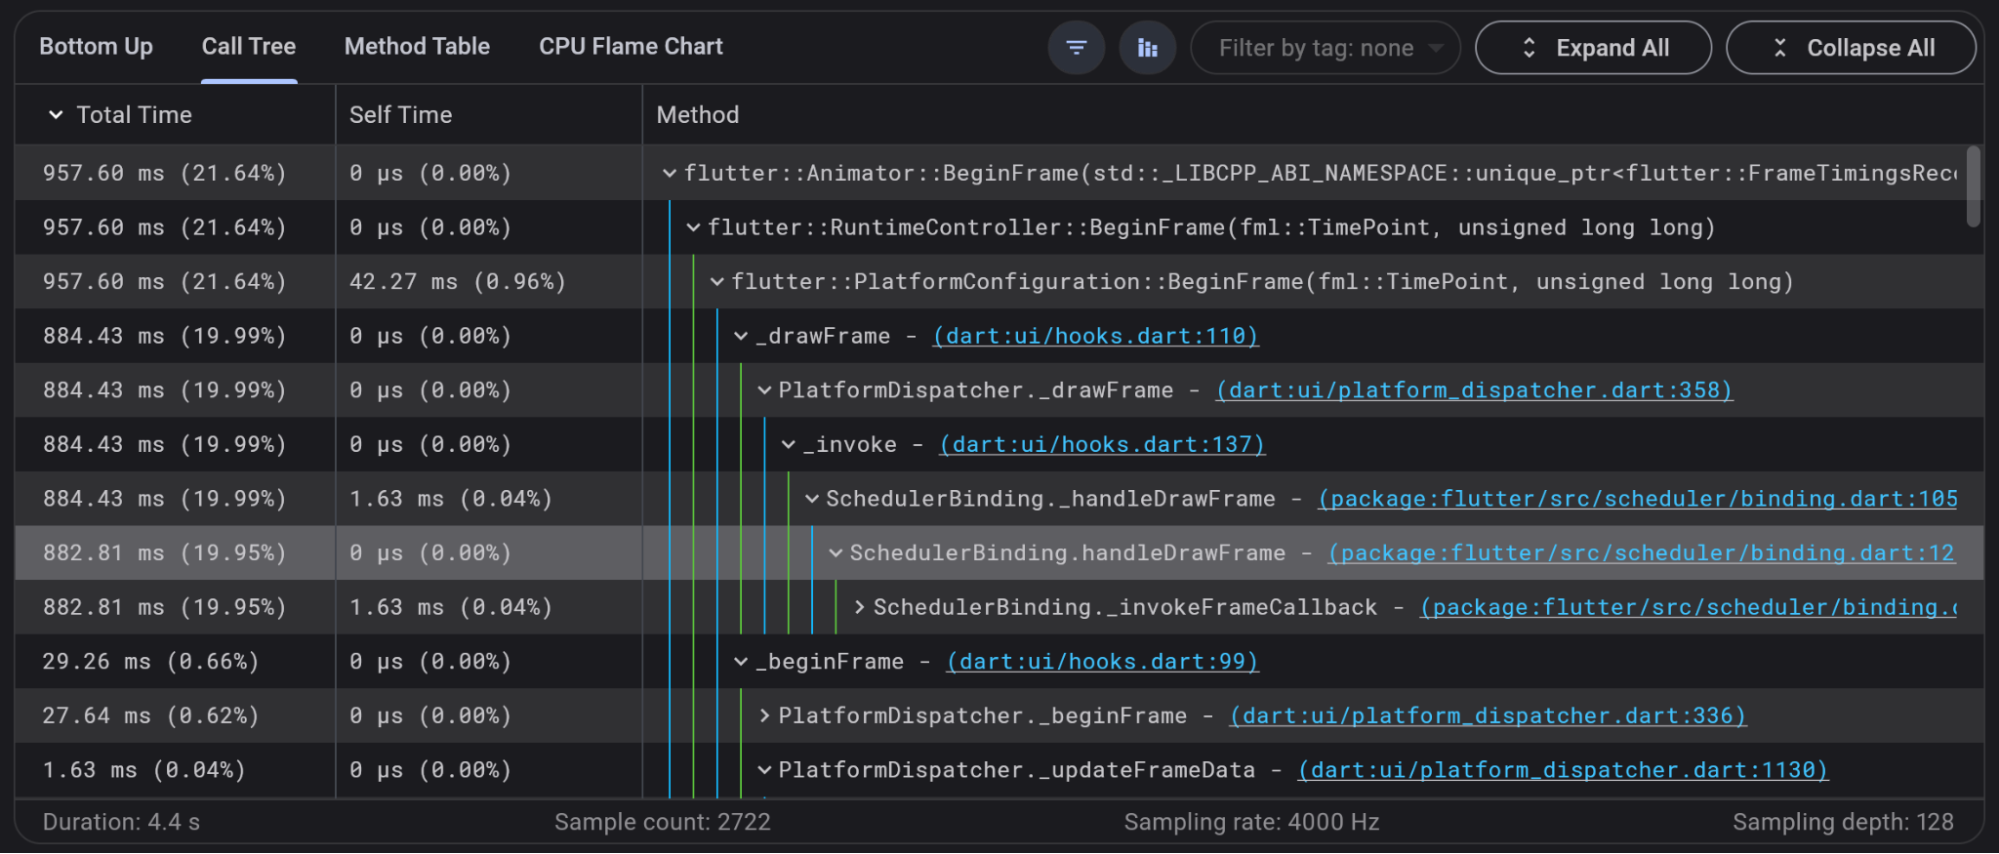
See the [Guidelines](#guidelines) section below to learn how to
enable the blue and green vertical lines seen in this image.
Tooltips can help you understand the values in each column:
**Total time**
: Time that a method spent executing its own code as well as
the code for any methods it called.
**Self time**
: Time the method spent executing only its own code.
### Method table
The method table provides CPU statistics for each method
contained in a CPU profile. In the table on the left,
all available methods are listed with their **total** and
**self** time.
**Total** time is the combined time that a method spent
**anywhere** on the call stack, or in other words,
the time a method spent executing its own code and
any code for methods that it called.
**Self** time is the combined time that a method spent
on top of the call stack, or in other words,
the time a method spent executing only its own code.
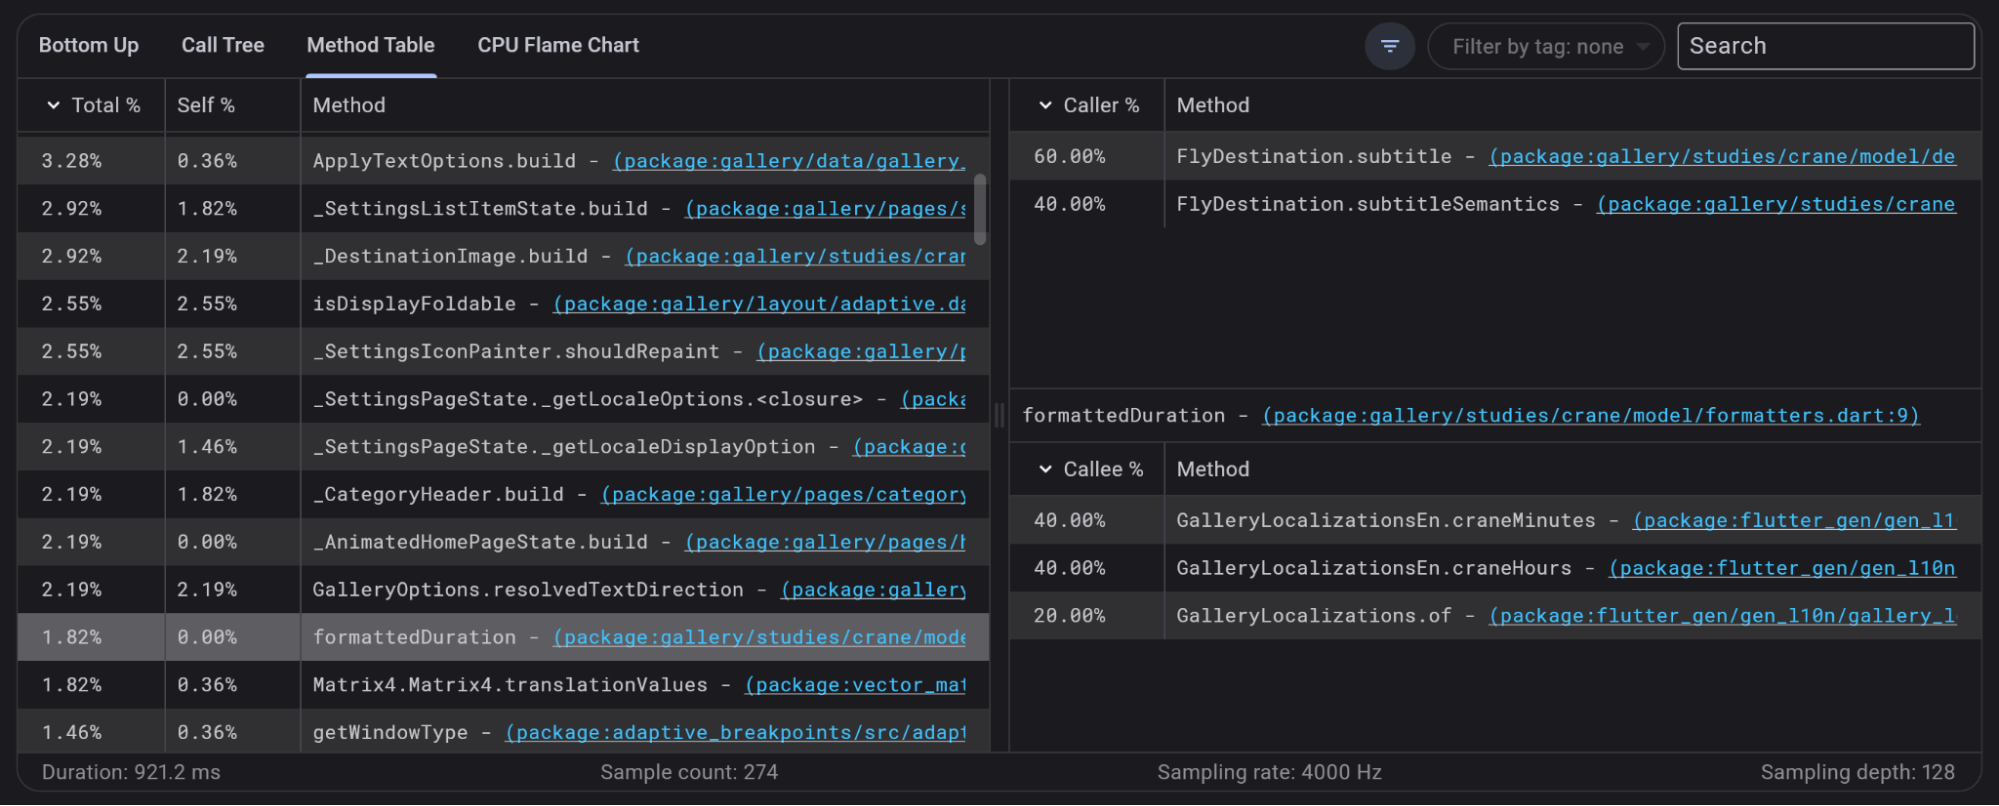
Selecting a method from the table on the left shows
the call graph for that method. The call graph shows
a method's callers and callees and their respective
caller / callee percentages.
### Flame chart
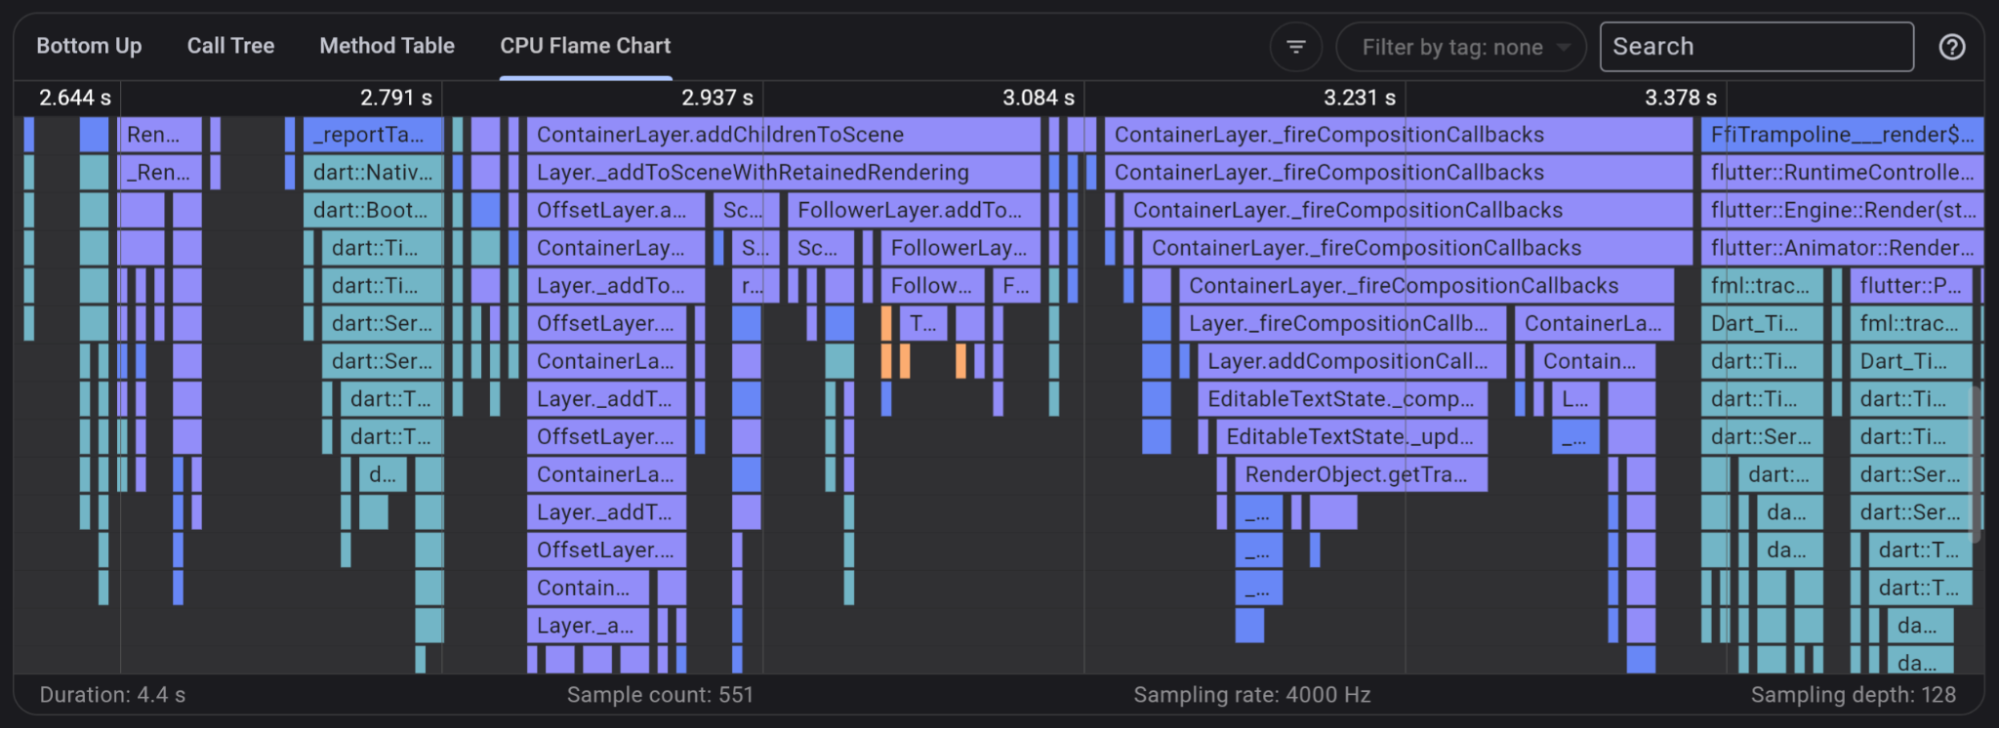
The flame chart view is a graphical representation of
the [Call tree](#call-tree). This is a top-down view
of a CPU profile, so in this chart,
the top-most method calls the one below it.
The width of each flame chart element represents the
amount of time that a method spent on the call stack.
Like the Call tree, this view is useful for identifying
expensive paths in a CPU profile.
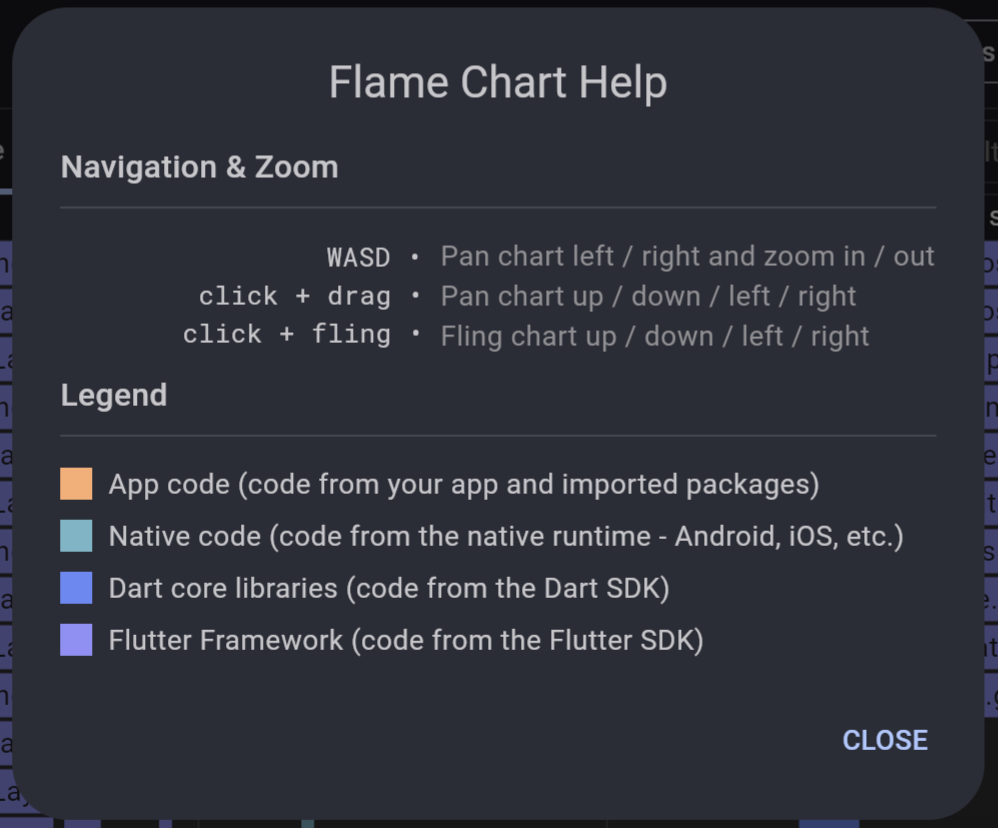
The help menu, which can be opened by clicking the `?` icon
next to the search bar, provides information about how to
navigate and zoom within the chart and a color-coded legend.
{:width="70%"}
### CPU sampling rate
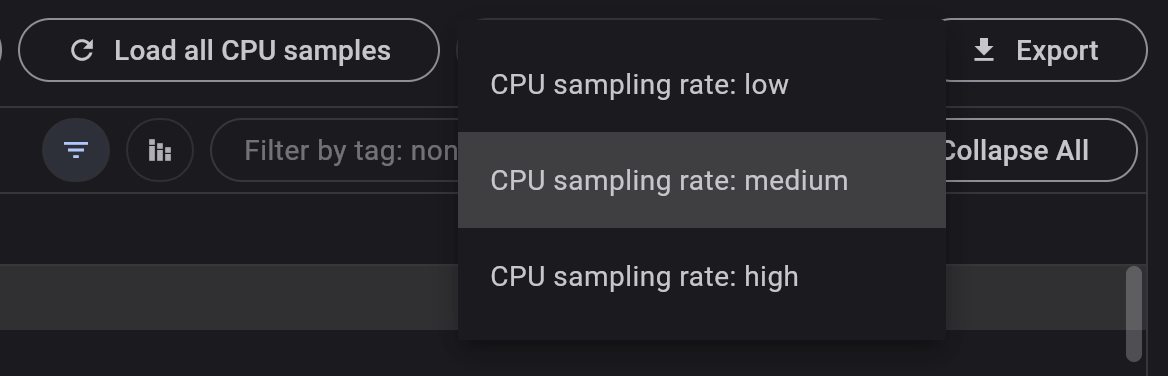
DevTools sets a rate at which the VM collects CPU samples:
1 sample / 250 μs (microseconds).
This is selected by default on
the CPU profiler page as "Cpu sampling rate: medium".
This rate can be modified using the selector at the top
of the page.
{:width="70%"}
The **low**, **medium**, and **high** sampling rates are
1,000 Hz, 4,000 Hz, and 20,000 Hz, respectively.
It's important to know the trade-offs
of modifying this setting.
A profile that was recorded with a **higher** sampling rate
yields a more fine-grained CPU profile with more samples.
This might affect performance of your app since the VM
is being interrupted more often to collect samples.
This also causes the VM's CPU sample buffer to overflow more quickly.
The VM has limited space where it can store CPU sample information.
At a higher sampling rate, the space fills up and begins
to overflow sooner than it would have if a lower sampling
rate was used.
This means that you might not have access to CPU samples
from the beginning of the recorded profile, depending
on whether the buffer overflows during the time of recording.
A profile that was recorded with a lower sampling rate
yields a more coarse-grained CPU profile with fewer samples.
This affects your app's performance less,
but you might have access to less information about what
the CPU was doing during the time of the profile.
The VM's sample buffer also fills more slowly, so you can see
CPU samples for a longer period of app run time.
This means that you have a better chance of viewing CPU
samples from the beginning of the recorded profile.
### Filtering
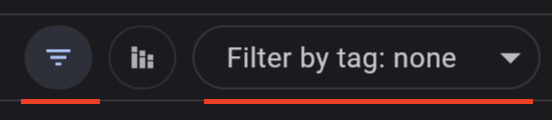
When viewing a CPU profile, you can filter the data by
library, method name, or [`UserTag`][].
[`UserTag`]: https://api.flutter.dev/flutter/dart-developer/UserTag-class.html
## Guidelines
When looking at a call tree or bottom up view,
sometimes the trees can be very deep.
To help with viewing parent-child relationships in a deep tree,
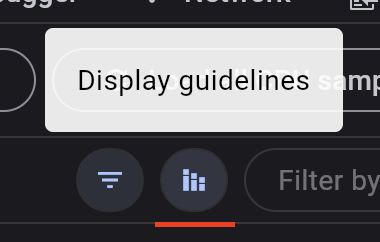
enable the **Display guidelines** option.
This adds vertical guidelines between parent and child in the tree.
[analyze performance]: https://developers.google.com/web/tools/chrome-devtools/evaluate-performance/
## Other resources
To learn how to use DevTools to analyze
the CPU usage of a compute-intensive Mandelbrot app,
check out a guided [CPU Profiler View tutorial][profiler-tutorial].
Also, learn how to analyze CPU usage when the app
uses isolates for parallel computing.
[profiler-tutorial]: https://medium.com/@fluttergems/mastering-dart-flutter-devtools-cpu-profiler-view-part-6-of-8-31e24eae6bf8