# Use a native language debugger
> How to connect a native debugger to your running Flutter app.
:::note
This guide presumes you understand general debugging,
have installed Flutter and git, and have familiarity
with the Dart language as well as one of the following
languages: Java, Kotlin, Swift, or Objective-C.
:::
If you write Flutter apps only with Dart code,
you can debug your code using your IDE's debugger.
The Flutter team recommends VS Code.
If you write a platform-specific plugin or
use platform-specific libraries, you can debug
that portion of your code with a native debugger.
- To debug iOS or macOS code written in Swift or Objective-C,
you can use Xcode.
- To debug Android code written in Java or Kotlin,
you can use Android Studio.
- To debug Windows code written in C++, you can use Visual Studio.
This guide shows you how you can connect _two_
debuggers to your Dart app, one for Dart, and one for the native code.
## Debug Dart code
This guide describes how to use VS Code to debug your Flutter app.
You can also use your preferred IDE with the
Flutter and Dart plugins installed and configured.
## Debug Dart code using VS Code
The following procedure explains how to use the Dart debugger
with the default sample Flutter app.
The featured components in VS Code work and appear when
debugging your own Flutter project as well.
1. Create a basic Flutter app.
```console
$ flutter create my_app
```
```console
Creating project my_app...
Resolving dependencies in my_app...
Got dependencies in my_app.
Wrote 129 files.
All done!
You can find general documentation for Flutter at: https://docs.flutter.dev/
Detailed API documentation is available at: https://api.flutter.dev/
If you prefer video documentation, consider: https://www.youtube.com/c/flutterdev
In order to run your application, type:
$ cd my_app
$ flutter run
Your application code is in my_app/lib/main.dart.
```
```console
$ cd my_app
```
1. Open the `lib\main.dart` file in the Flutter app using
VS Code.
1. Click the bug icon
().
This opens the following panes in VS Code:
- **Debug**
- **Debug Console**
- **Widget Inspector**
The first time you run the debugger takes the longest.
1. Test the debugger.
a. In `main.dart`, click on this line:
```dart
_counter++;
```
b. Press Shift + F9.
This adds a breakpoint where the
`_counter` variable increments.
c. In the app, click the **+** button
to increment the counter. The app pauses.
d. At this point, VS Code displays:
- In the **Editor Groups**:
- The highlighted breakpoint in `main.dart`
- The widget hierarchy for the Flutter app
in the **Widget Tree** of the **Widget Inspector**
- In the **side bar**:
- The state of the app in the **Call Stack** section
- The value of the `this` local variable in the **Variables** section
- In the **panel**:
- The log of the Flutter app in the **Debug console**
### VS Code Flutter debugger
The Flutter plugin for VS Code adds a number of components
to the VS Code user interface.
#### Changes to VS Code interface
When launched, the Flutter debugger adds debugging tools to the
VS Code interface.
The following screenshot and table explain the purpose of each tool.
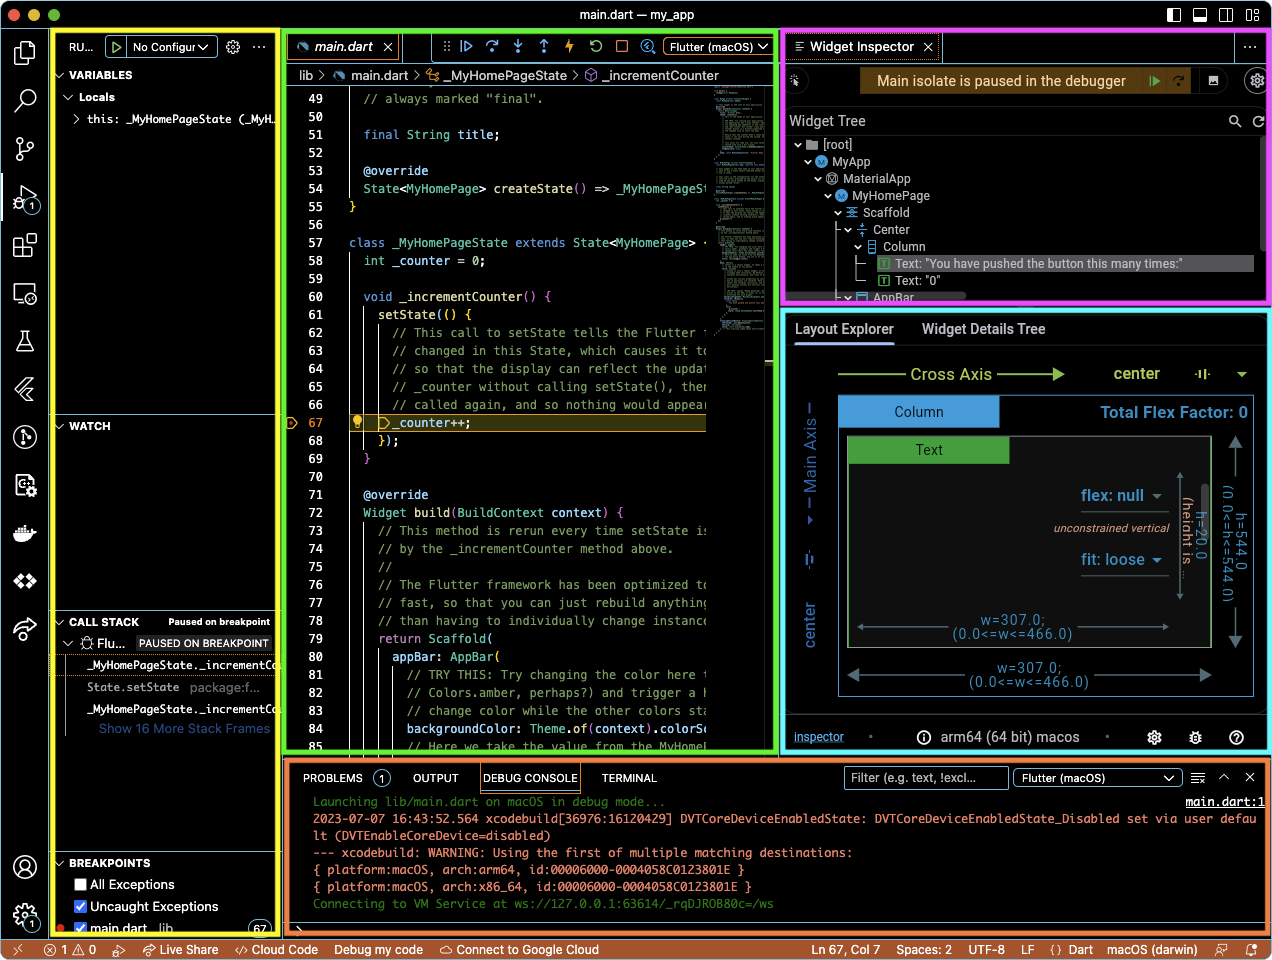
| Highlight Color in Screenshot | Bar, Panel, or Tab | Contents |
|-------------------------------|---------------------|-----------------------------------------------------------------------------------|
| **Yellow** | Variables | List of current values of variables in the Flutter app |
| | Watch | List of items you chose to track in the Flutter app |
| | Call Stack | Stack of active subroutines in the Flutter app |
| | Breakpoints | List of exceptions and set breakpoints that you set |
| **Green** | `` | Files that you are editing |
| **Pink** | Widget Inspector | Hierarchy of widgets in the running Flutter app |
| **Blue** | Layout Explorer | Visual of how Flutter placed the widget you selected in the Widget Inspector |
| | Widget Details Tree | List of properties of the widget selected in the Widget Inspector |
| **Orange** | Problems | List of issues the Dart analyzer found in the current Dart file |
| | Output | Response that the Flutter app returns when building an app |
| | Debug Console | Logs or error messages that the Flutter app generates while debugging |
| | Terminal | System shell prompt contained in VS Code |
{:.table .table-striped}
To change where the panel (in **orange**) appears in VS Code,
go to **View** > **Appearance** > **Panel Position**.
#### VS Code Flutter debugging toolbar
The toolbar allows you to debug using any debugger.
You can step in, out, and over Dart statements, hot reload, or resume the app.

| Icon | Action | Default keyboard shortcut |
|-----------------------------------------------------|-----------------------|-------------------------------------------------------|
| 
| Start or Resume | F5 |
| 
| Pause | F6 |
| 
| Step Over | F10 |
| 
| Step Into | F11 |
| 
| Step Out | Shift + F11 |
| 
| Hot Reload | Ctrl + F5 |
| 
| Hot Restart | Shift + Special + F5 |
| 
| Stop | Shift + F5 |
| 
| Open Widget Inspector | |
{:.table .table-striped}
## Update test Flutter app
For the remainder of this guide, you need to update the
test Flutter app. This update adds native code to debug.
1. Open the `lib/main.dart` file using your preferred IDE.
1. Replace the contents of `main.dart` with the following code.
Expand to see Flutter code for this example
```dart title="lib/main.dart"
// Copyright 2023 The Flutter Authors. All rights reserved.
// Use of this source code is governed by a BSD-style license that can be
// found in the LICENSE file.
import 'package:flutter/material.dart';
import 'package:url_launcher/url_launcher.dart';
void main() {
runApp(const MyApp());
}
class MyApp extends StatelessWidget {
const MyApp({super.key});
@override
Widget build(BuildContext context) {
return MaterialApp(
title: 'URL Launcher',
theme: ThemeData(
colorSchemeSeed: Colors.purple,
brightness: Brightness.light,
),
home: const MyHomePage(title: 'URL Launcher'),
);
}
}
class MyHomePage extends StatefulWidget {
const MyHomePage({super.key, required this.title});
final String title;
@override
State createState() => _MyHomePageState();
}
class _MyHomePageState extends State {
Future? _launched;
Future _launchInBrowser(Uri url) async {
if (!await launchUrl(
url,
mode: LaunchMode.externalApplication,
)) {
throw Exception('Could not launch $url');
}
}
Future _launchInWebView(Uri url) async {
if (!await launchUrl(
url,
mode: LaunchMode.inAppWebView,
)) {
throw Exception('Could not launch $url');
}
}
Widget _launchStatus(BuildContext context, AsyncSnapshot snapshot) {
if (snapshot.hasError) {
return Text('Error: ${snapshot.error}');
} else {
return const Text('');
}
}
@override
Widget build(BuildContext context) {
final Uri toLaunch = Uri(
scheme: 'https',
host: 'docs.flutter.dev',
path: 'testing/native-debugging');
return Scaffold(
appBar: AppBar(
title: Text(widget.title),
),
body: Center(
child: Column(
mainAxisAlignment: MainAxisAlignment.center,
children: [
Padding(
padding: const EdgeInsets.all(16),
child: Text(toLaunch.toString()),
),
FilledButton(
onPressed: () => setState(() {
_launched = _launchInBrowser(toLaunch);
}),
child: const Text('Launch in browser'),
),
const Padding(padding: EdgeInsets.all(16)),
FilledButton(
onPressed: () => setState(() {
_launched = _launchInWebView(toLaunch);
}),
child: const Text('Launch in app'),
),
const Padding(padding: EdgeInsets.all(16.0)),
FutureBuilder(future: _launched, builder: _launchStatus),
],
),
),
);
}
}
```
1. To add the `url_launcher` package as a dependency,
run `flutter pub add`:
```console
$ flutter pub add url_launcher
```
```console
Resolving dependencies...
collection 1.17.1 (1.17.2 available)
+ flutter_web_plugins 0.0.0 from sdk flutter
matcher 0.12.15 (0.12.16 available)
material_color_utilities 0.2.0 (0.8.0 available)
+ plugin_platform_interface 2.1.4
source_span 1.9.1 (1.10.0 available)
stream_channel 2.1.1 (2.1.2 available)
test_api 0.5.1 (0.6.1 available)
+ url_launcher 6.1.11
+ url_launcher_android 6.0.36
+ url_launcher_ios 6.1.4
+ url_launcher_linux 3.0.5
+ url_launcher_macos 3.0.5
+ url_launcher_platform_interface 2.1.3
+ url_launcher_web 2.0.17
+ url_launcher_windows 3.0.6
Changed 10 dependencies!
```
1. To check what changed with the codebase:
{: type="a"}
1. In Linux or macOS, run this `find` command.
```console
$ find ./ -mmin -120
```
```console
./ios/Flutter/Debug.xcconfig
./ios/Flutter/Release.xcconfig
./linux/flutter/generated_plugin_registrant.cc
./linux/flutter/generated_plugins.cmake
./macos/Flutter/Flutter-Debug.xcconfig
./macos/Flutter/Flutter-Release.xcconfig
./macos/Flutter/GeneratedPluginRegistrant.swift
./pubspec.lock
./pubspec.yaml
./windows/flutter/generated_plugin_registrant.cc
./windows/flutter/generated_plugins.cmake
```
1. In Windows, run this command in the command prompt.
```ps
Get-ChildItem C:\dev\example\ -Rescurse | Where-Object {$_.LastWriteTime -gt (Get-Date).AddDays(-1)}
```
```ps
C:\dev\example\ios\Flutter\
Mode LastWriteTime Length Name
---- ------------- ------ ----
8/1/2025 9:15 AM Debug.xcconfig
8/1/2025 9:15 AM Release.xcconfig
C:\dev\example\linux\flutter\
Mode LastWriteTime Length Name
---- ------------- ------ ----
8/1/2025 9:15 AM generated_plugin_registrant.cc
8/1/2025 9:15 AM generated_plugins.cmake
C:\dev\example\macos\Flutter\
Mode LastWriteTime Length Name
---- ------------- ------ ----
8/1/2025 9:15 AM Flutter-Debug.xcconfig
8/1/2025 9:15 AM Flutter-Release.xcconfig
8/1/2025 9:15 AM GeneratedPluginRegistrant.swift
C:\dev\example\
Mode LastWriteTime Length Name
---- ------------- ------ ----
8/1/2025 9:15 AM pubspec.lock
8/1/2025 9:15 AM pubspec.yaml
C:\dev\example\windows\flutter\
Mode LastWriteTime Length Name
---- ------------- ------ ----
8/1/2025 9:15 AM generated_plugin_registrant.cc
8/1/2025 9:15 AM generated_plugins.cmake
```
Installing `url_launcher` added config files and code files
for all target platforms in the Flutter app directory.
## Debug Dart and native language code at the same time
This section explains how to debug the Dart code in your Flutter app
and any native code with its regular debugger.
This capability allows you to leverage Flutter's hot reload
when editing native code.
### Debug Dart and Android code using Android Studio
To debug native Android code, you need a Flutter app that contains
Android code. In this section, you learn how to connect
the Dart, Java, and Kotlin debuggers to your app.
You don't need VS Code to debug both Dart and Android code.
This guide includes the VS Code instructions to be consistent
with the Xcode and Visual Studio guides.
These section uses the same example Flutter `url_launcher` app created
in [Update test Flutter app](#update-test-flutter-app).
#### Build the Android version of the Flutter app in the Terminal
To generate the needed Android platform dependencies,
run the `flutter build` command.
```console
flutter build appbundle --debug
```
```console
Running Gradle task 'bundleDebug'... 27.1s
✓ Built build/app/outputs/bundle/debug/app-debug.aab.
```
#### Start debugging with VS Code first {:#from-vscode-to-android-studio}
If you use VS Code to debug most of your code, start with this section.
1. To open the Flutter app directory, go to
**File** >
**Open Folder...** and choose the `my_app` directory.
1. Open the `lib/main.dart` file.
1. If you can build an app for more than one device,
you must select the device first.
Go to
**View** >
**Command Palette...**
You can also press Ctrl / Cmd +
Shift + P.
1. Type `flutter select`.
1. Click the **Flutter: Select Device** command.
1. Choose your target device.
1. Click the debug icon
().
This opens the **Debug** pane and launches the app.
Wait for the app to launch on the device and for the debug pane to
indicate **Connected**.
The debugger takes longer to launch the first time.
Subsequent launches start faster.
This Flutter app contains two buttons:
- **Launch in browser**: This button opens this page in the
default browser of your device.
- **Launch in app**: This button opens this page within your app.
This button only works for iOS or Android. Desktop apps launch a browser.
#### Attach to the Flutter process in Android Studio
1. Click the **Attach debugger to Android process** button.
()
:::tip
If this button doesn't appear in the **Projects** menu bar, verify that
you opened Flutter _application_ project but _not a Flutter plugin_.
:::
1. The **process** dialog displays one entry for each connected device.
Select **show all processes** to display available processes for each
device.
1. Choose the process to which you want to attach.
For this guide, select the `com.example.my_app` process
using the **Emulator Pixel_5_API_33**.
1. Locate the tab for **Android Debugger** in the **Debug** pane.
1. In the **Project** pane, expand
**my_app_android** >
**android** >
**app** >
**src** >
**main** >
**java** >
**io.flutter plugins**.
1. Double click **GeneratedProjectRegistrant** to open the
Java code in the **Edit** pane.
At the end of this procedure, both the Dart and Android debuggers interact
with the same process.
Use either, or both, to set breakpoints, examine stack, resume execution
and the like. In other words, debug!
#### Start debugging with Android Studio first {:#from-android-studio}
If you use Android Studio to debug most of your code, start with this section.
1. To open the Flutter app directory, go to
**File** >
**Open...** and choose the `my_app` directory.
1. Open the `lib/main.dart` file.
1. Choose a virtual Android device.
Go to the toolbar, open the leftmost dropdown menu, and click on
**Open Android Emulator: \**.
You can choose any installed emulator that's doesn't include `arm64`.
1. From that same menu, select the virtual Android device.
1. From the toolbar, click **Run 'main.dart'**.
You can also press Ctrl + Shift + R.
After the app displays in the emulator, continue to the next step.
1. Click the **Attach debugger to Android process** button.
()
:::tip
If this button doesn't appear in the **Projects** menu bar, verify that
you opened Flutter _application_ project but _not a Flutter plugin_.
:::
1. The **process** dialog displays one entry for each connected device.
Select **show all processes** to display available processes for each
device.
1. Choose the process to which you want to attach.
For this guide, select the `com.example.my_app` process
using the **Emulator Pixel_5_API_33**.
1. Locate the tab for **Android Debugger** in the **Debug** pane.
1. In the **Project** pane, expand
**my_app_android** >
**android** >
**app** >
**src** >
**main** >
**java** >
**io.flutter plugins**.
1. Double click **GeneratedProjectRegistrant** to open the
Java code in the **Edit** pane.
At the end of this procedure, both the Dart and Android debuggers interact
with the same process.
Use either, or both, to set breakpoints, examine stack, resume execution
and the like. In other words, debug!
### Debug Dart and iOS code using Xcode
To debug iOS code, you need a Flutter app that contains iOS code.
In this section, you learn to connect two debuggers to your app:
Flutter via VS Code and Xcode. You need to run both VS Code and Xcode.
These section uses the same example Flutter `url_launcher` app created
in [Update test Flutter app](#update-test-flutter-app).
#### Build the iOS version of the Flutter app in the Terminal
To generate the needed iOS platform dependencies,
run the `flutter build` command.
```console
$ flutter build ios --config-only --no-codesign --debug
```
```console
Warning: Building for device with codesigning disabled. You will have to manually codesign before deploying to device.
Building com.example.myApp for device (ios)...
```
#### Start debugging with VS Code first {:#vscode-ios}
If you use VS Code to debug most of your code, start with this section.
##### Start the Dart debugger in VS Code
1. To open the Flutter app directory, go to
**File** >
**Open Folder...** and choose the `my_app` directory.
1. Open the `lib/main.dart` file.
1. If you can build an app for more than one device,
you must select the device first.
Go to
**View** >
**Command Palette...**
You can also press Ctrl / Cmd +
Shift + P.
1. Type `flutter select`.
1. Click the **Flutter: Select Device** command.
1. Choose your target device.
1. Click the debug icon
().
This opens the **Debug** pane and launches the app.
Wait for the app to launch on the device and for the debug pane to
indicate **Connected**.
The debugger takes longer to launch the first time.
Subsequent launches start faster.
This Flutter app contains two buttons:
- **Launch in browser**: This button opens this page in the
default browser of your device.
- **Launch in app**: This button opens this page within your app.
This button only works for iOS or Android. Desktop apps launch a browser.
##### Attach to the Flutter process in Xcode
To attach to the Flutter app in Xcode:
1. Go to **Debug** > **Attach to Process**.
1. Select **Runner**. It should be at the top of the
**Attach to Process** menu under the **Likely Targets** heading.
#### Start debugging with Xcode first {:#xcode-ios}
If you use Xcode to debug most of your code, start with this section.
##### Start the Xcode debugger
1. Open `ios/Runner.xcworkspace` from your Flutter app directory.
1. Select the correct device using the **Scheme** menu in the toolbar.
If you have no preference, choose **iPhone Pro 14**.
1. Run this Runner as a normal app in Xcode.
When the run completes, the **Debug** area at the bottom of Xcode displays
a message with the Dart VM service URI. It resembles the following response:
```console
2023-07-12 14:55:39.966191-0500 Runner[58361:53017145]
flutter: The Dart VM service is listening on
http://127.0.0.1:50642/00wEOvfyff8=/
```
1. Copy the Dart VM service URI.
##### Attach to the Dart VM in VS Code
1. To open the command palette, go to
**View** >
**Command Palette...**
You can also press Cmd + Shift + P.
1. Type `debug`.
1. Click the **Debug: Attach to Flutter on Device** command.
1. In the **Paste an VM Service URI** box, paste the URI you copied
from Xcode and press Enter.
### Debug Dart and macOS code using Xcode
To debug macOS code, you need a Flutter app that contains macOS code.
In this section, you learn to connect two debuggers to your app:
Flutter via VS Code and Xcode. You need to run both VS Code and Xcode.
These section uses the same example Flutter `url_launcher` app created
in [Update test Flutter app](#update-test-flutter-app).
#### Build the macOS version of the Flutter app in the Terminal
To generate the needed macOS platform dependencies,
run the `flutter build` command.
```console
flutter build macos --debug
```
```console
Building macOS application...
```
#### Start debugging with VS Code first {:#vscode-macos}
##### Start the debugger in VS Code
1. To open the Flutter app directory, go to
**File** >
**Open Folder...** and choose the `my_app` directory.
1. Open the `lib/main.dart` file.
1. If you can build an app for more than one device,
you must select the device first.
Go to
**View** >
**Command Palette...**
You can also press Ctrl / Cmd +
Shift + P.
1. Type `flutter select`.
1. Click the **Flutter: Select Device** command.
1. Choose your target device.
1. Click the debug icon
().
This opens the **Debug** pane and launches the app.
Wait for the app to launch on the device and for the debug pane to
indicate **Connected**.
The debugger takes longer to launch the first time.
Subsequent launches start faster.
This Flutter app contains two buttons:
- **Launch in browser**: This button opens this page in the
default browser of your device.
- **Launch in app**: This button opens this page within your app.
This button only works for iOS or Android. Desktop apps launch a browser.
##### Attach to the Flutter process in Xcode
1. To attach to the Flutter app, go to
**Debug** >
**Attach to Process** >
**Runner**.
**Runner** should be at the top of the **Attach to Process** menu
under the **Likely Targets** heading.
#### Start debugging with Xcode first {:#xcode-macos}
##### Start the debugger in Xcode
1. Open `macos/Runner.xcworkspace` from your Flutter app directory.
1. Run this Runner as a normal app in Xcode.
When the run completes, the **Debug** area at the bottom of Xcode displays
a message with the Dart VM service URI. It resembles the following response:
```console
2023-07-12 14:55:39.966191-0500 Runner[58361:53017145]
flutter: The Dart VM service is listening on
http://127.0.0.1:50642/00wEOvfyff8=/
```
1. Copy the Dart VM service URI.
##### Attach to the Dart VM in VS Code
1. To open the command palette, go to **View** > **Command Palette...**
You can also press Cmd + Shift + P.
1. Type `debug`.
1. Click the **Debug: Attach to Flutter on Device** command.
1. In the **Paste an VM Service URI** box, paste the URI you copied
from Xcode and press Enter.
### Debug Dart and C++ code using Visual Studio
To debug C++ code, you need a Flutter app that contains C++ code.
In this section, you learn to connect two debuggers to your app:
Flutter via VS Code and Visual Studio.
You need to run both VS Code and Visual Studio.
These section uses the same example Flutter `url_launcher` app created
in [Update test Flutter app](#update-test-flutter-app).
#### Build the Windows version of the Flutter app in PowerShell or the Command Prompt
To generate the needed Windows platform dependencies,
run the `flutter build` command.
```console
C:\> flutter build windows --debug
```
```console
Building Windows application... 31.4s
√ Built build\windows\runner\Debug\my_app.exe.
```
#### Start debugging with VS Code first {:#vscode-windows}
If you use VS Code to debug most of your code, start with this section.
##### Start the debugger in VS Code
1. To open the Flutter app directory, go to
**File** >
**Open Folder...** and choose the `my_app` directory.
1. Open the `lib/main.dart` file.
1. If you can build an app for more than one device,
you must select the device first.
Go to
**View** >
**Command Palette...**
You can also press Ctrl / Cmd +
Shift + P.
1. Type `flutter select`.
1. Click the **Flutter: Select Device** command.
1. Choose your target device.
1. Click the debug icon
().
This opens the **Debug** pane and launches the app.
Wait for the app to launch on the device and for the debug pane to
indicate **Connected**.
The debugger takes longer to launch the first time.
Subsequent launches start faster.
This Flutter app contains two buttons:
- **Launch in browser**: This button opens this page in the
default browser of your device.
- **Launch in app**: This button opens this page within your app.
This button only works for iOS or Android. Desktop apps launch a browser.
##### Attach to the Flutter process in Visual Studio
1. To open the project solution file, go to
**File** >
**Open** >
**Project/Solution…**
You can also press Ctrl + Shift + O.
1. Choose the `build/windows/my_app.sln` file in your Flutter app directory.
1. Go to **Debug** > **Attach to Process**.
You can also press Ctrl + Alt + P.
1. From the **Attach to Process** dialog box, choose `my_app.exe`.
Visual Studio starts monitoring the Flutter app.
#### Start debugging with Visual Studio first
If you use Visual Studio to debug most of your code, start with this section.
##### Start the local Windows debugger
1. To open the project solution file, go to
**File** >
**Open** >
**Project/Solution…**
You can also press Ctrl + Shift + O.
1. Choose the `build/windows/my_app.sln` file in your Flutter app directory.
1. Set `my_app` as the startup project.
In the **Solution Explorer**, right-click on `my_app` and select
**Set as Startup Project**.
1. Click **Local Windows Debugger** to start debugging.
You can also press F5.
When the Flutter app has started, a console window displays
a message with the Dart VM service URI. It resembles the following response:
```console
flutter: The Dart VM service is listening on http://127.0.0.1:62080/KPHEj2qPD1E=/
```
1. Copy the Dart VM service URI.
##### Attach to the Dart VM in VS Code
1. To open the command palette, go to
**View** >
**Command Palette...**
You can also press Cmd + Shift + P.
1. Type `debug`.
1. Click the **Debug: Attach to Flutter on Device** command.
1. In the **Paste an VM Service URI** box, paste the URI you copied
from Visual Studio and press Enter.
## Resources
Check out the following resources on debugging Flutter, iOS, Android,
macOS and Windows:
### Flutter
- [Debugging Flutter apps][]
- [Flutter inspector][] and the [DevTools][] docs
- [Performance profiling][]
[Debugging Flutter apps]: /testing/debugging
[Performance profiling]: /perf/ui-performance
### Android
You can find the following debugging resources on
[developer.android.com][].
- [Debug your app][]
- [Android Debug Bridge (adb)][]
### iOS and macOS
You can find the following debugging resources on
[developer.apple.com][].
- [Debugging][]
- [Instruments Help][]
### Windows
You can find debugging resources on [Microsoft Learn][].
- [Visual Studio Debugger][]
- [Learn to debug C++ code using Visual Studio][]
[Android Debug Bridge (adb)]: https://developer.android.com/studio/command-line/adb
[Debug your app]: https://developer.android.com/studio/debug
[Debugging]: https://developer.apple.com/support/debugging/
[developer.android.com]: https://developer.android.com
[developer.apple.com]: https://developer.apple.com
[DevTools]: /tools/devtools
[Flutter inspector]: /tools/devtools/inspector
[Instruments Help]: https://help.apple.com/instruments/mac/current/
[Microsoft Learn]: https://learn.microsoft.com/visualstudio/
[Visual Studio Debugger]: https://learn.microsoft.com/visualstudio/debugger/?view=vs-2022
[Learn to debug C++ code using Visual Studio]: https://learn.microsoft.com/visualstudio/debugger/getting-started-with-the-debugger-cpp?view=vs-2022